Playwright Check Suite runs can also be cancelled while they are in progress. Cancelled results are excluded from availability and performance metrics.
Understanding Result Data
You can select any check on the main Checkly dashboard to get an overview of the results they have produced so far.Check results overview
Select a check and you will see a breakdown of its recent runs, together with key availability and performance metrics.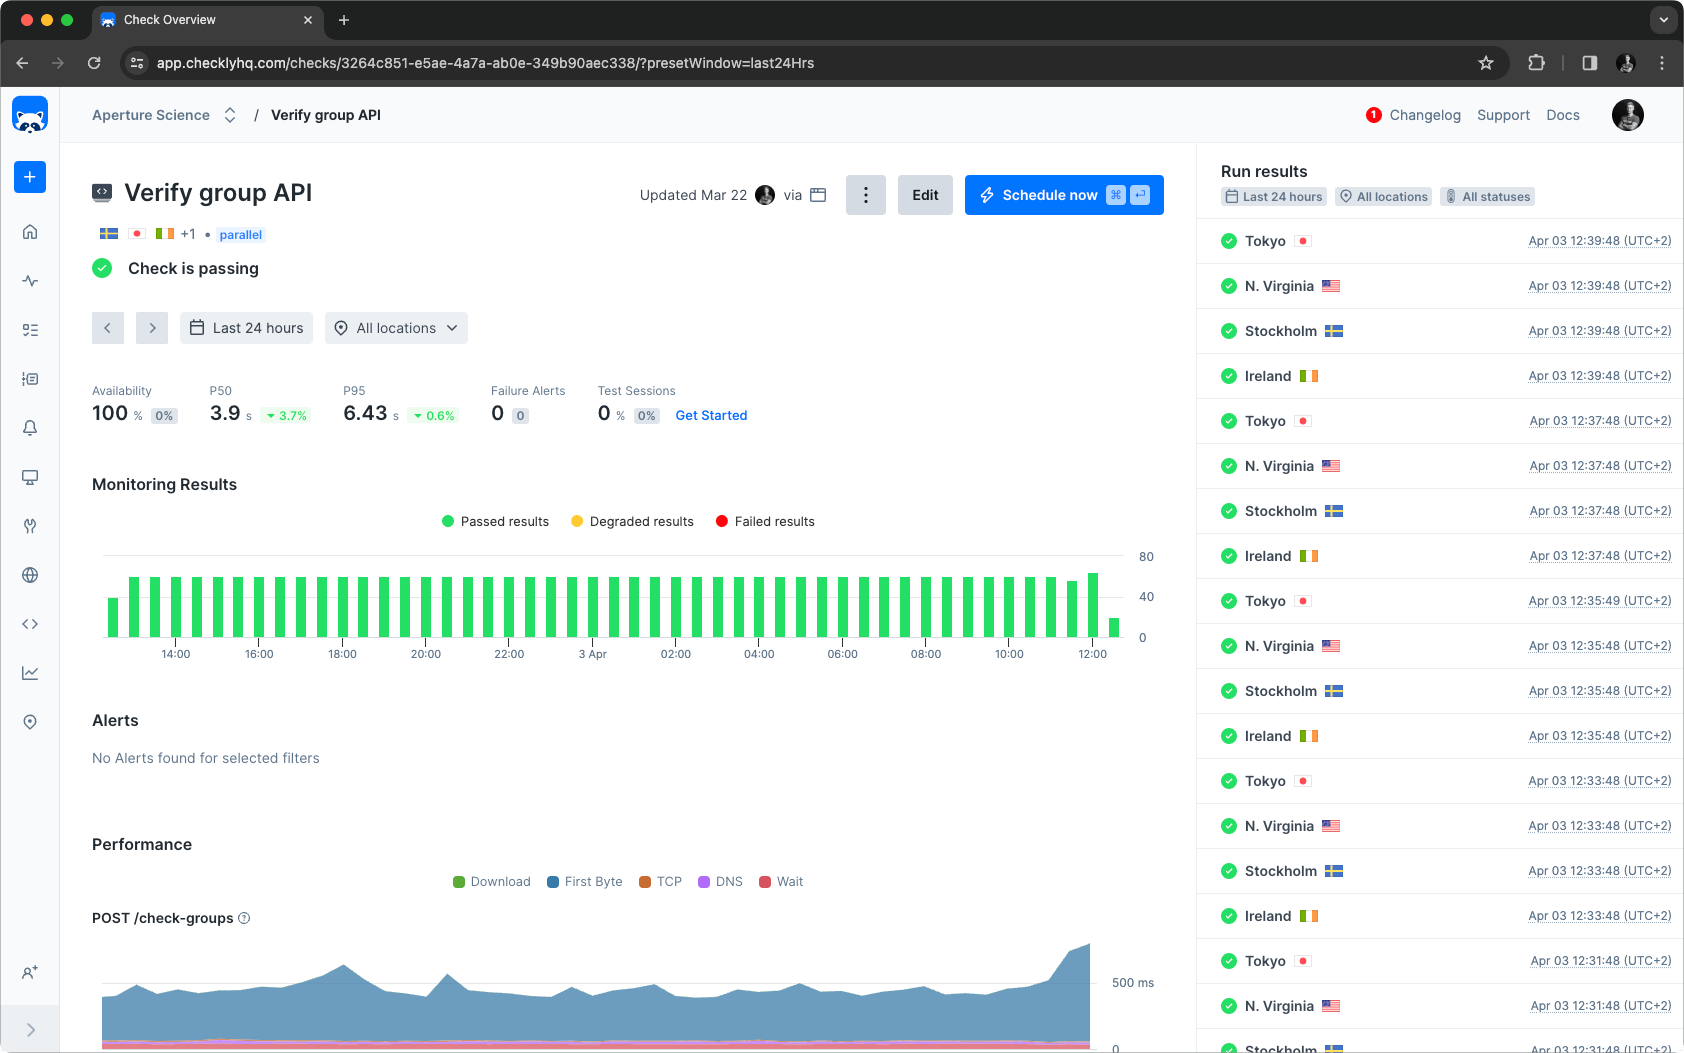
Summary section
The summary at the top of the page allows for filtering based on the page’s data points and the selected timeframe and locations. Retried check runs do not influence this section; only the final results are considered.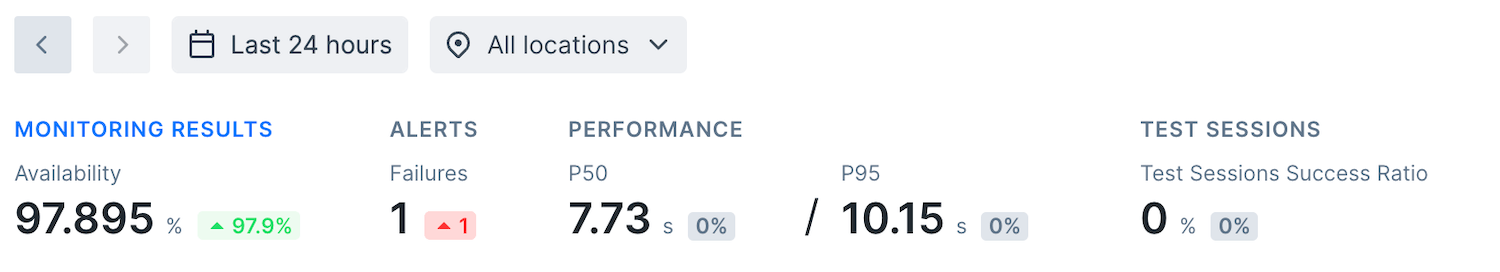
Monitoring results chart
The monitoring results chart shows a summary of the run results in the selected time period where each bar represents a part of that time period. You can change the time period in the summary section. Hovering a bar in the chart will show the results of all check runs executed during that time. You can quickly filter the check run results in the right sidepanel by clicking a bar in the chart.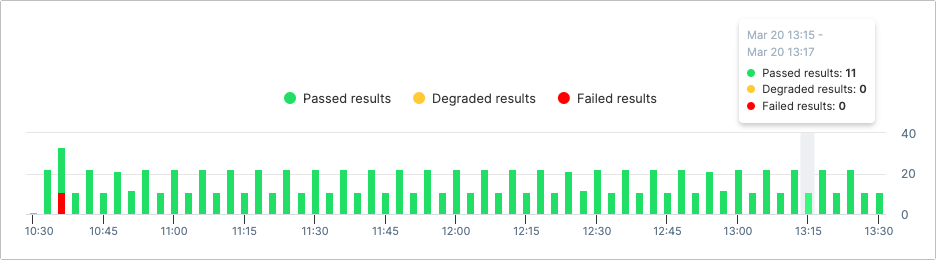
Monitoring results sidebar
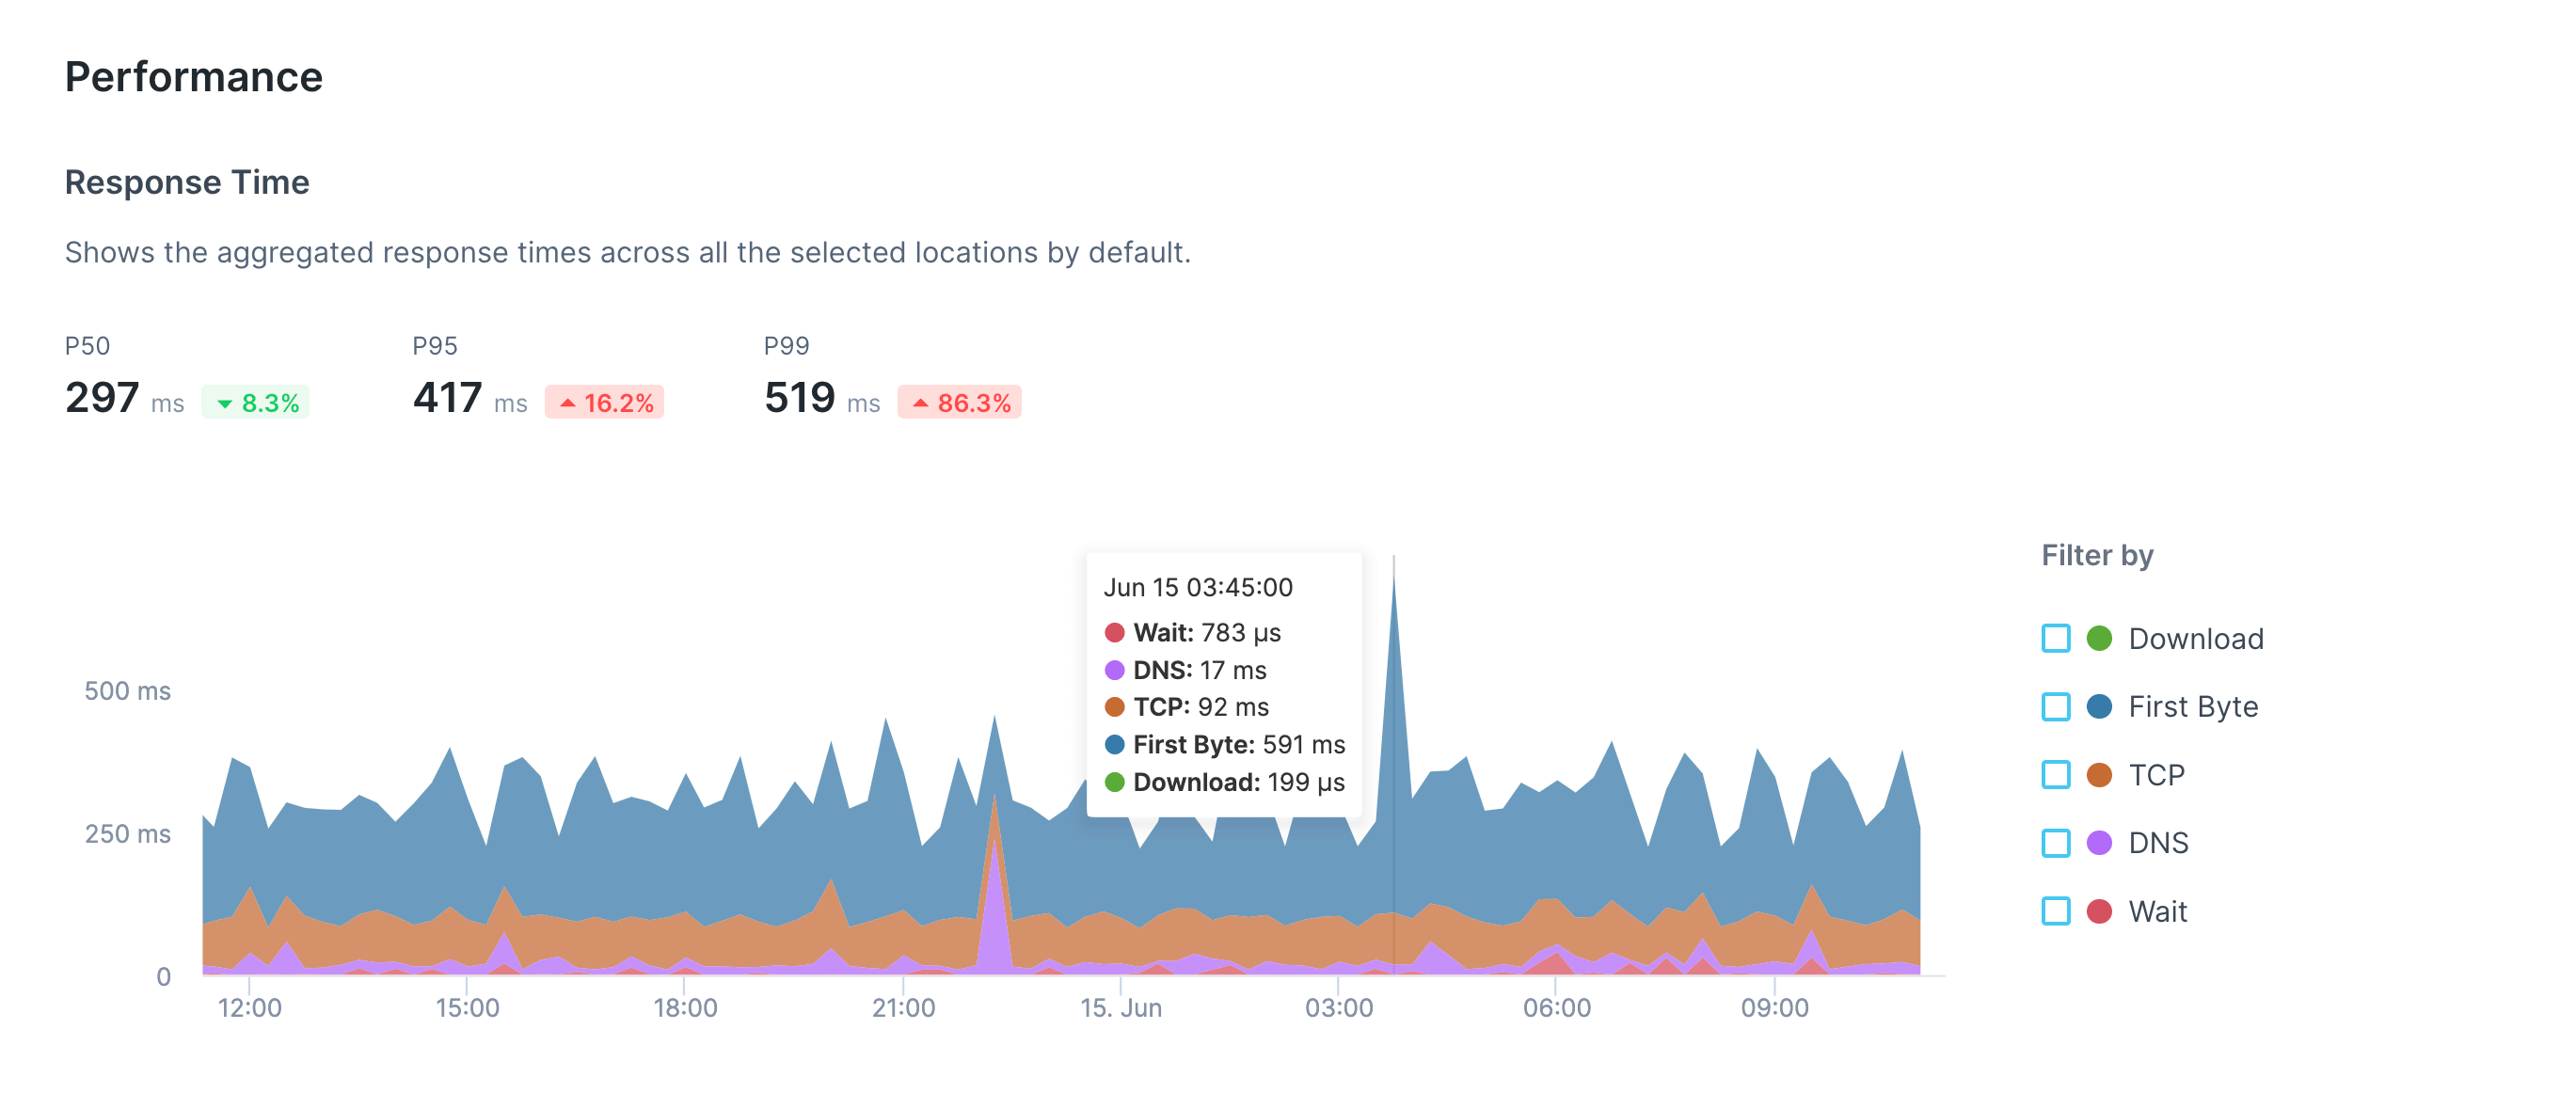
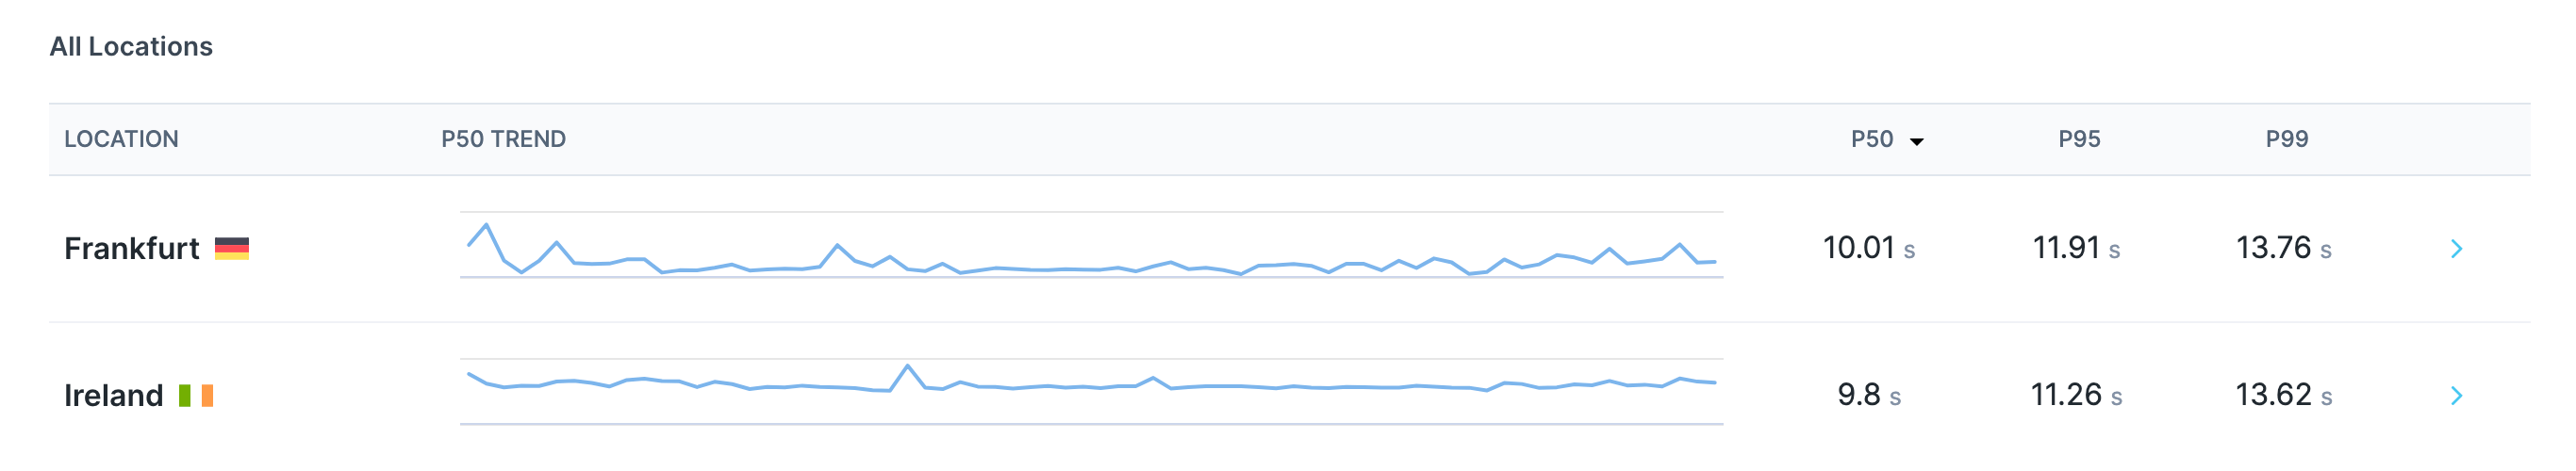
On the right side you can view the check result broken down per check run and location for the selected time frame. If you select a bar in the monitoring results chart it will filter out the corresponding results in the sidebar. Click any result to navigate to the check results screen for detailed information about the check run.Performance
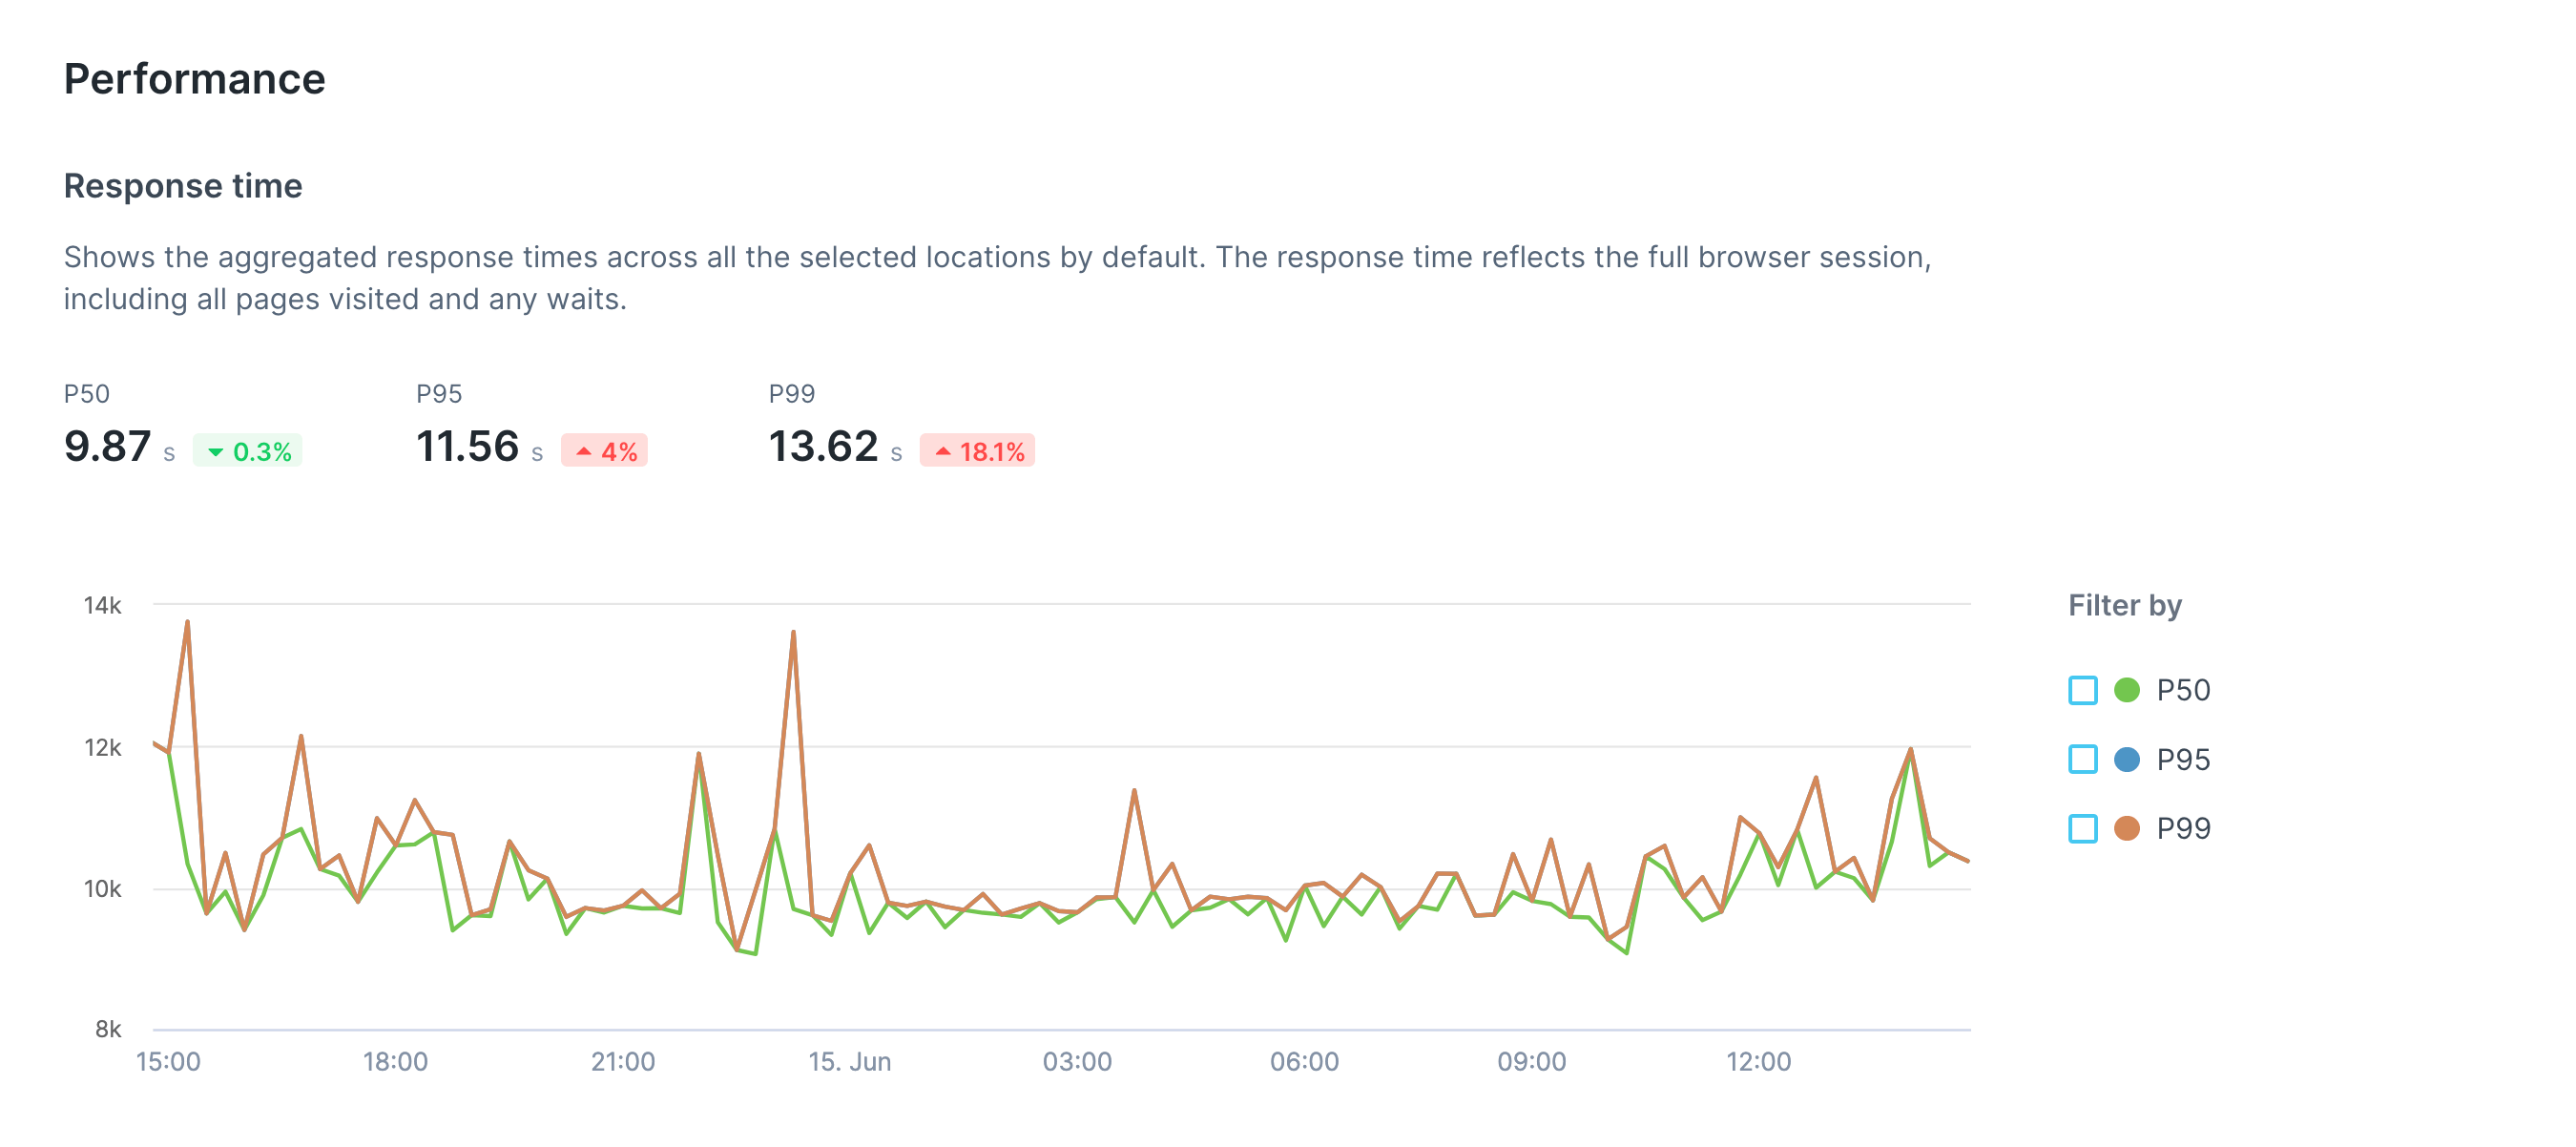
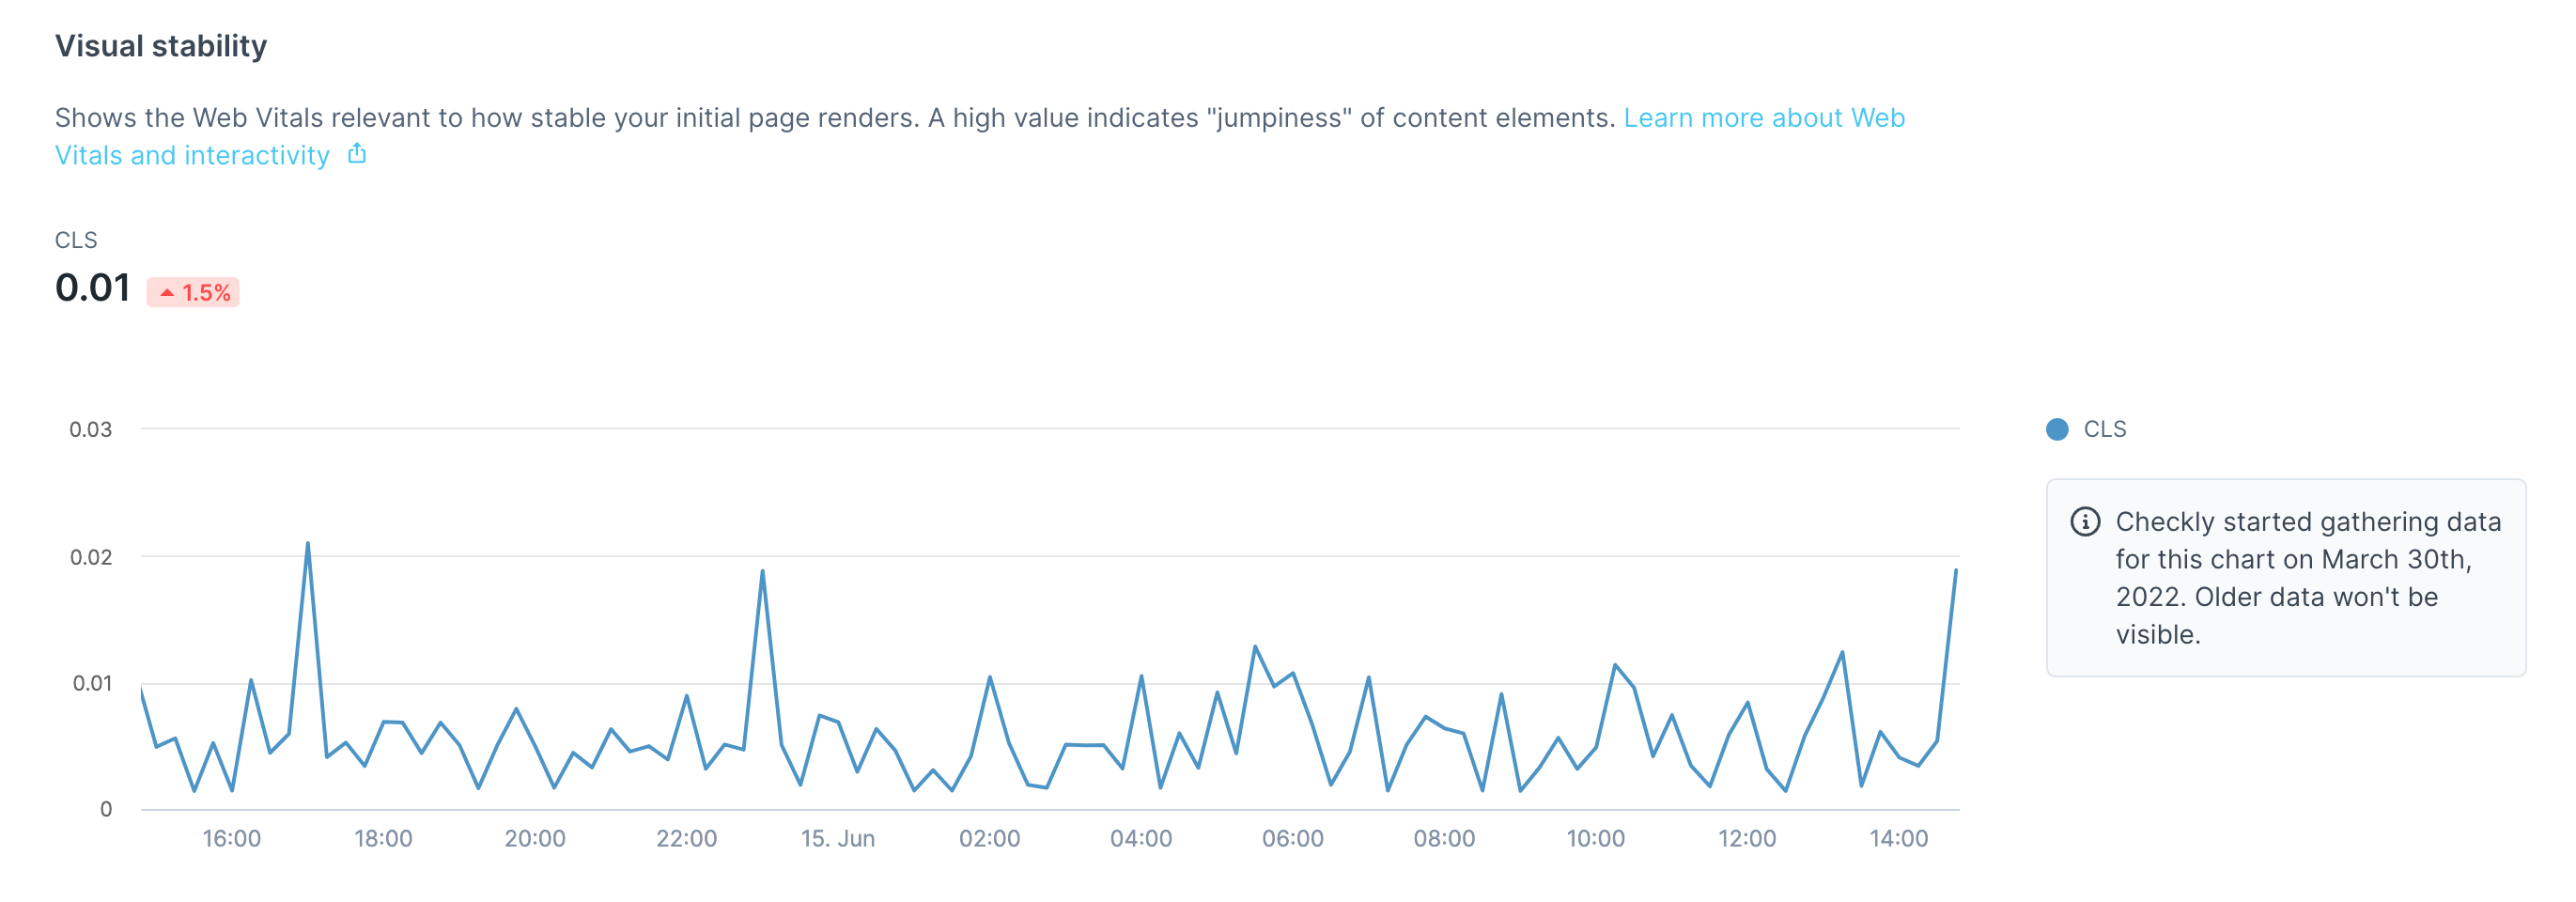
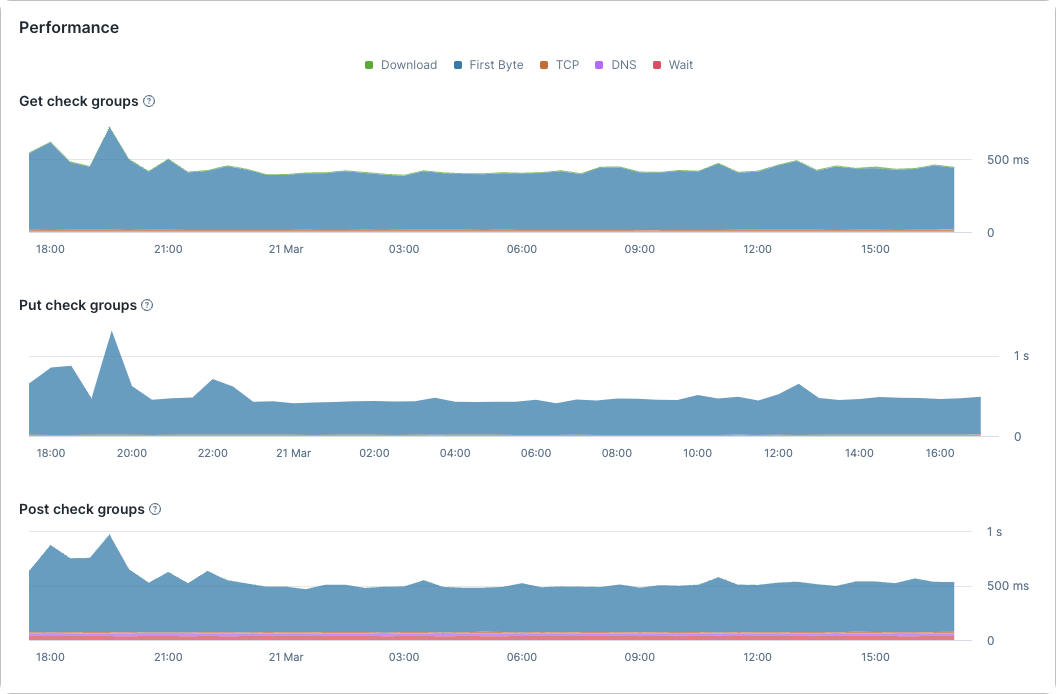
Depending on the type of check, different performance metrics will be shown in the Performance section. For Browser checks, several performance metrics are shown in separate charts:-
The total duration of the check run
-
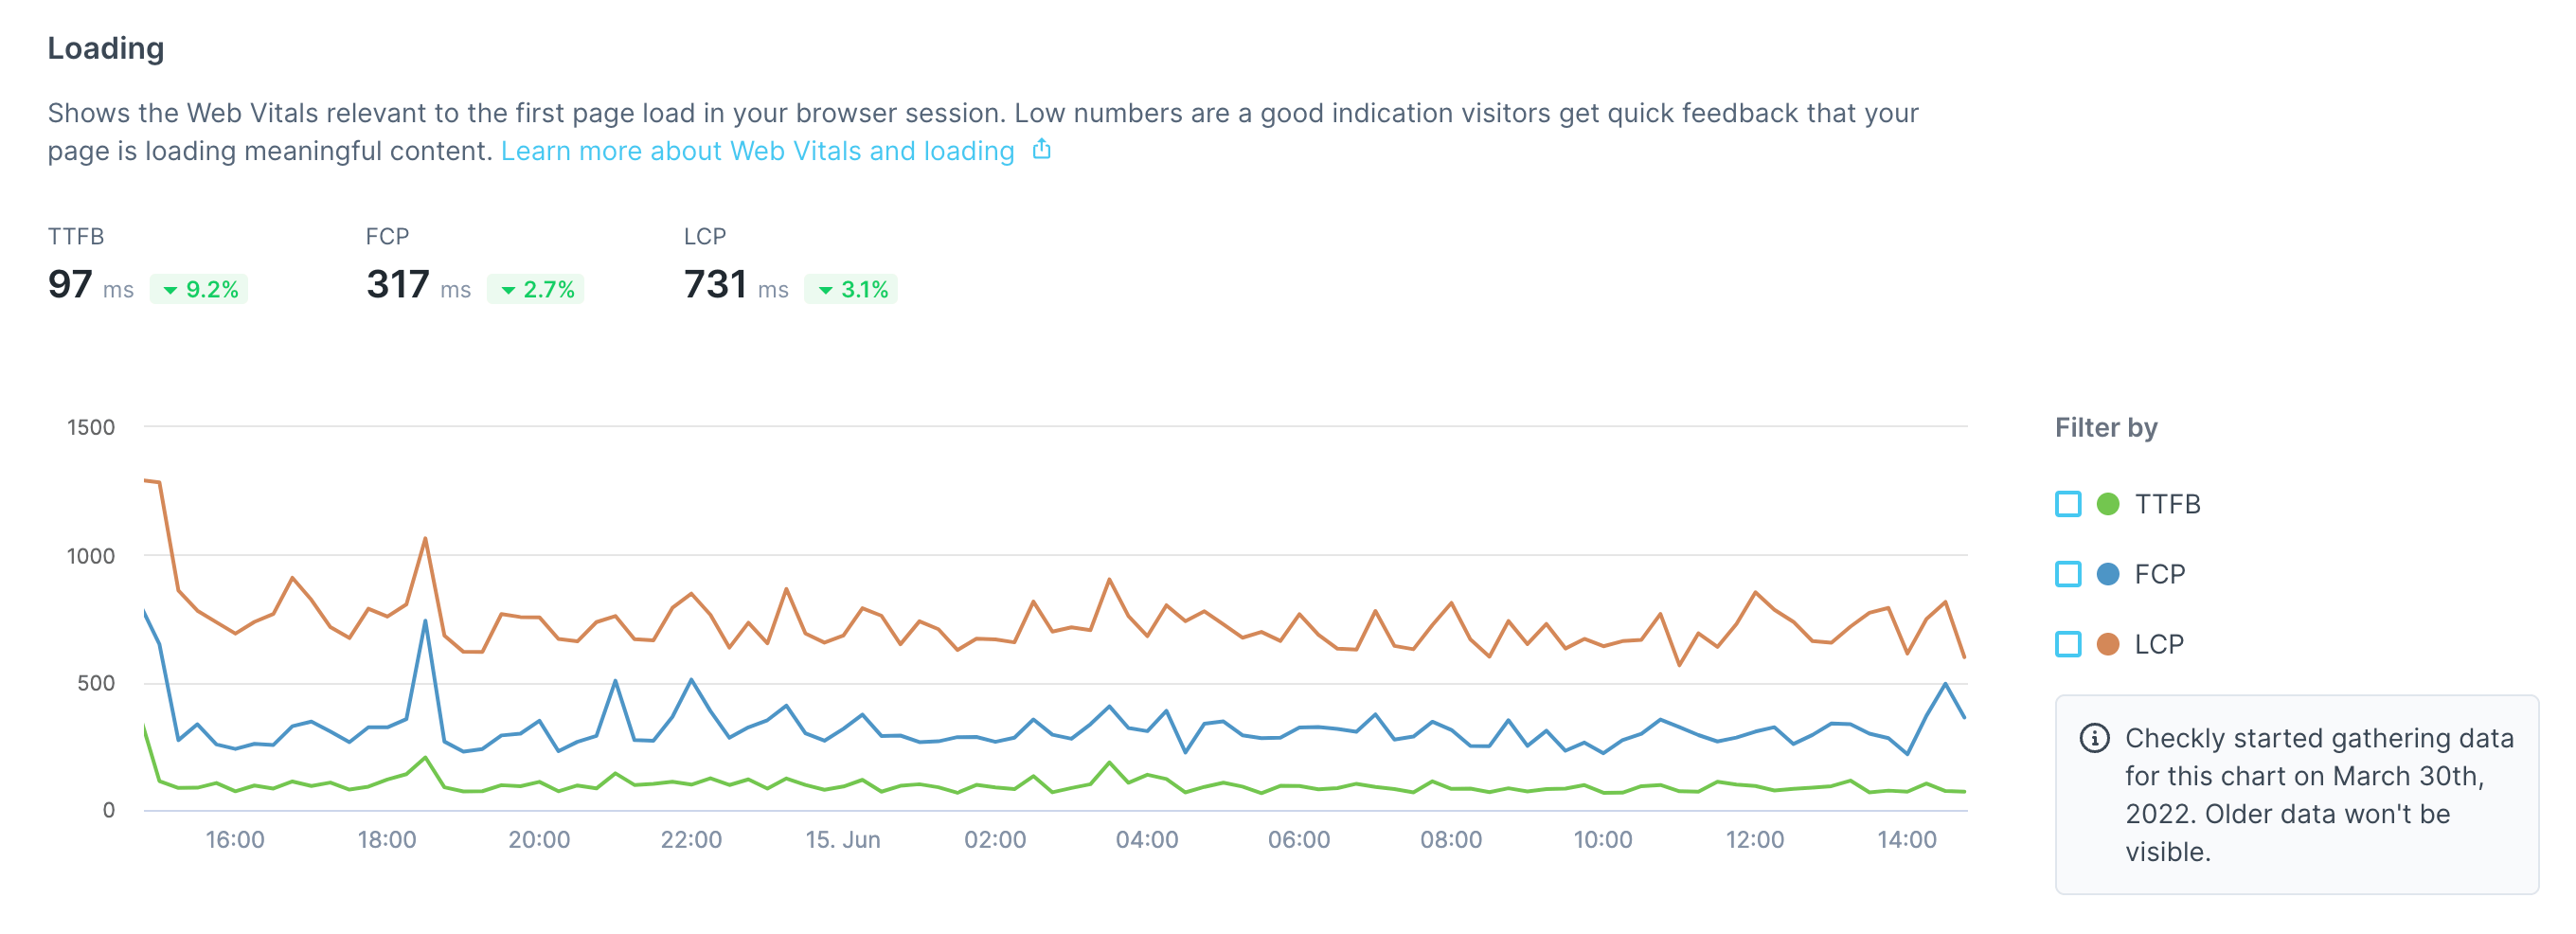
Load timings for the first page navigation
-
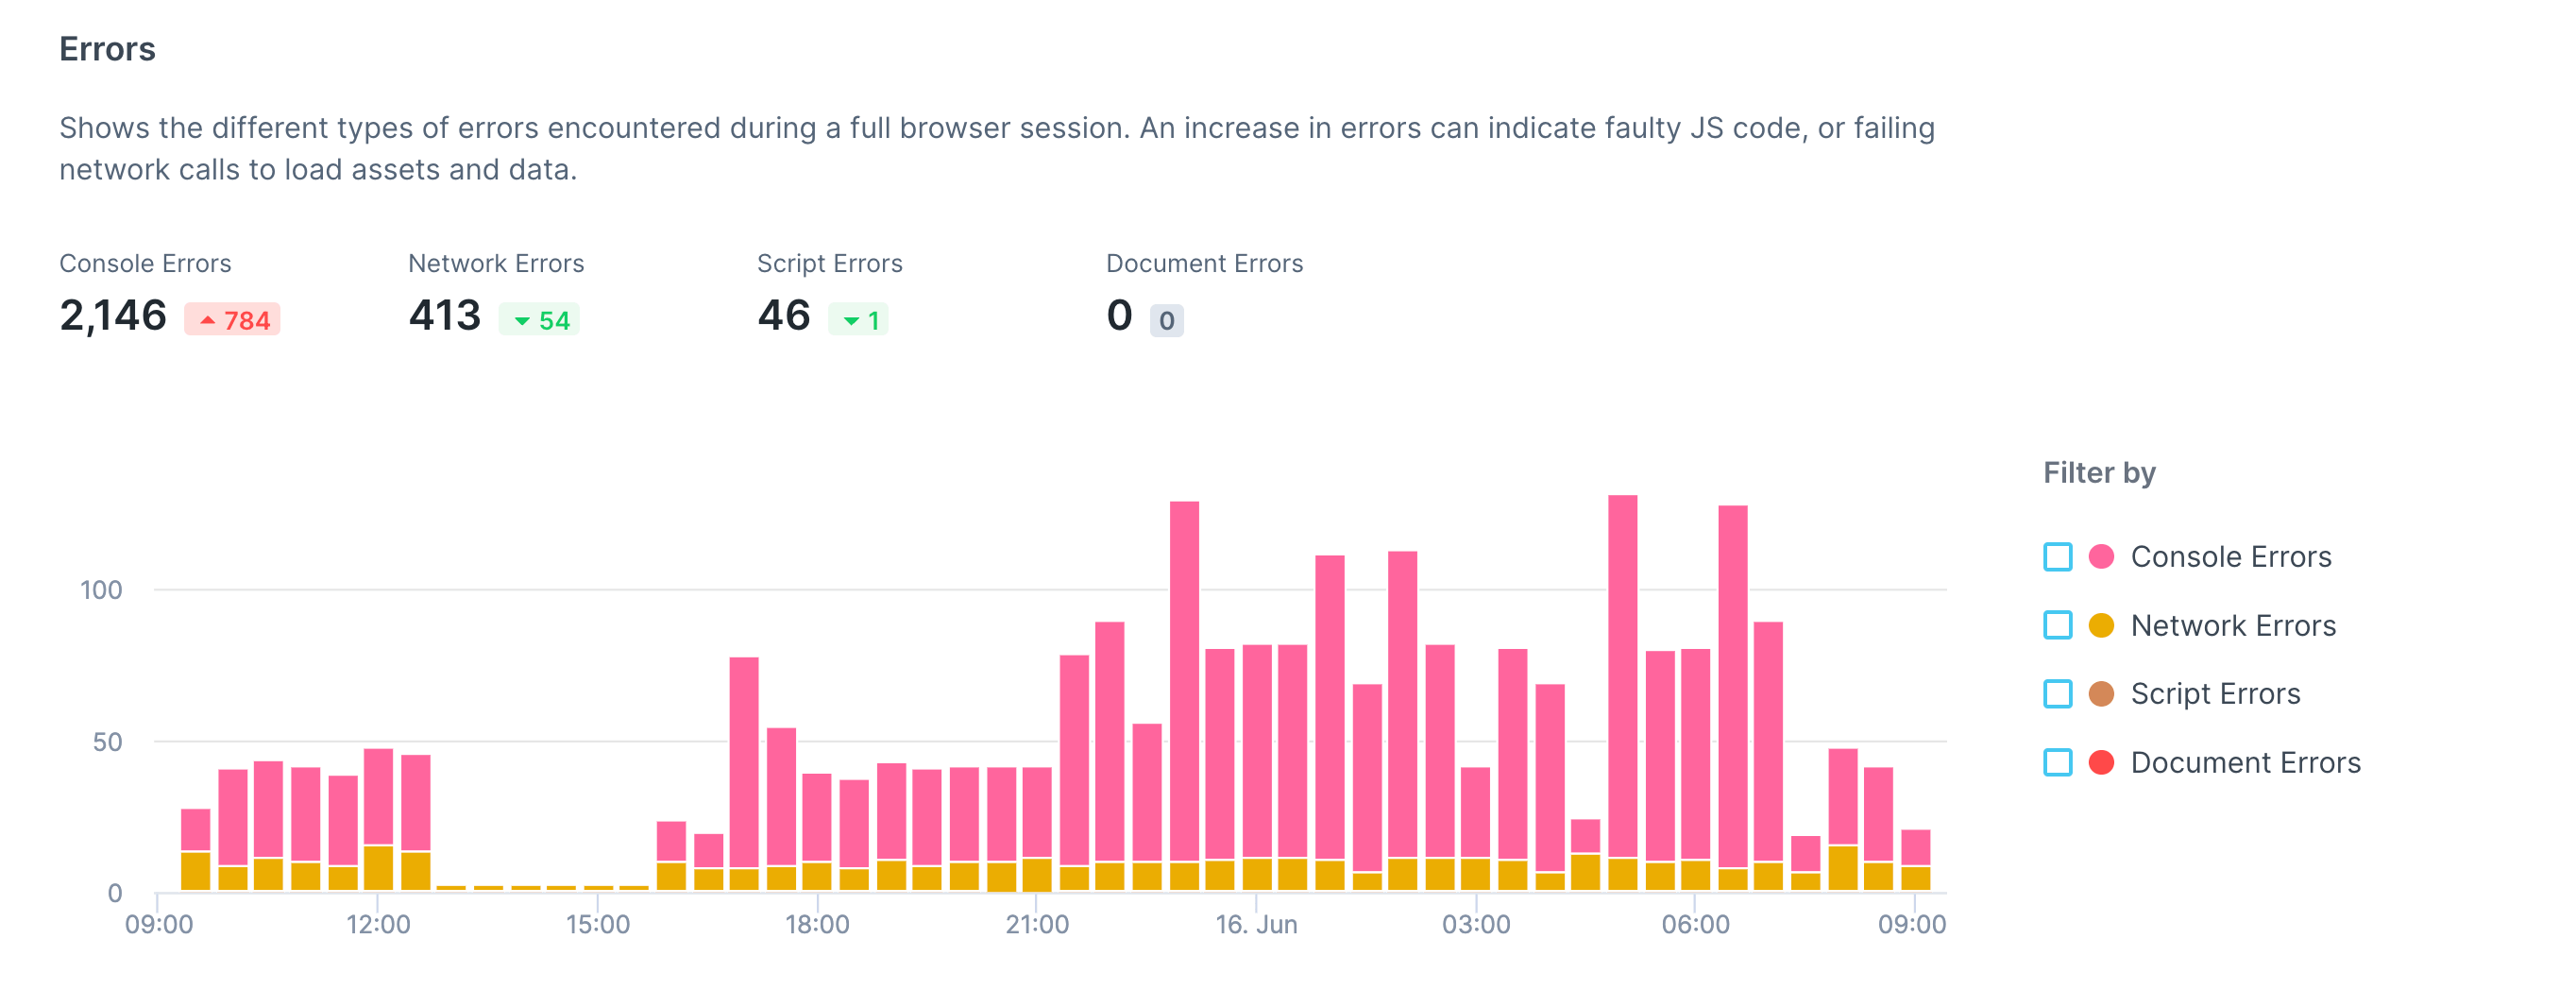
A breakdown of different error types
-
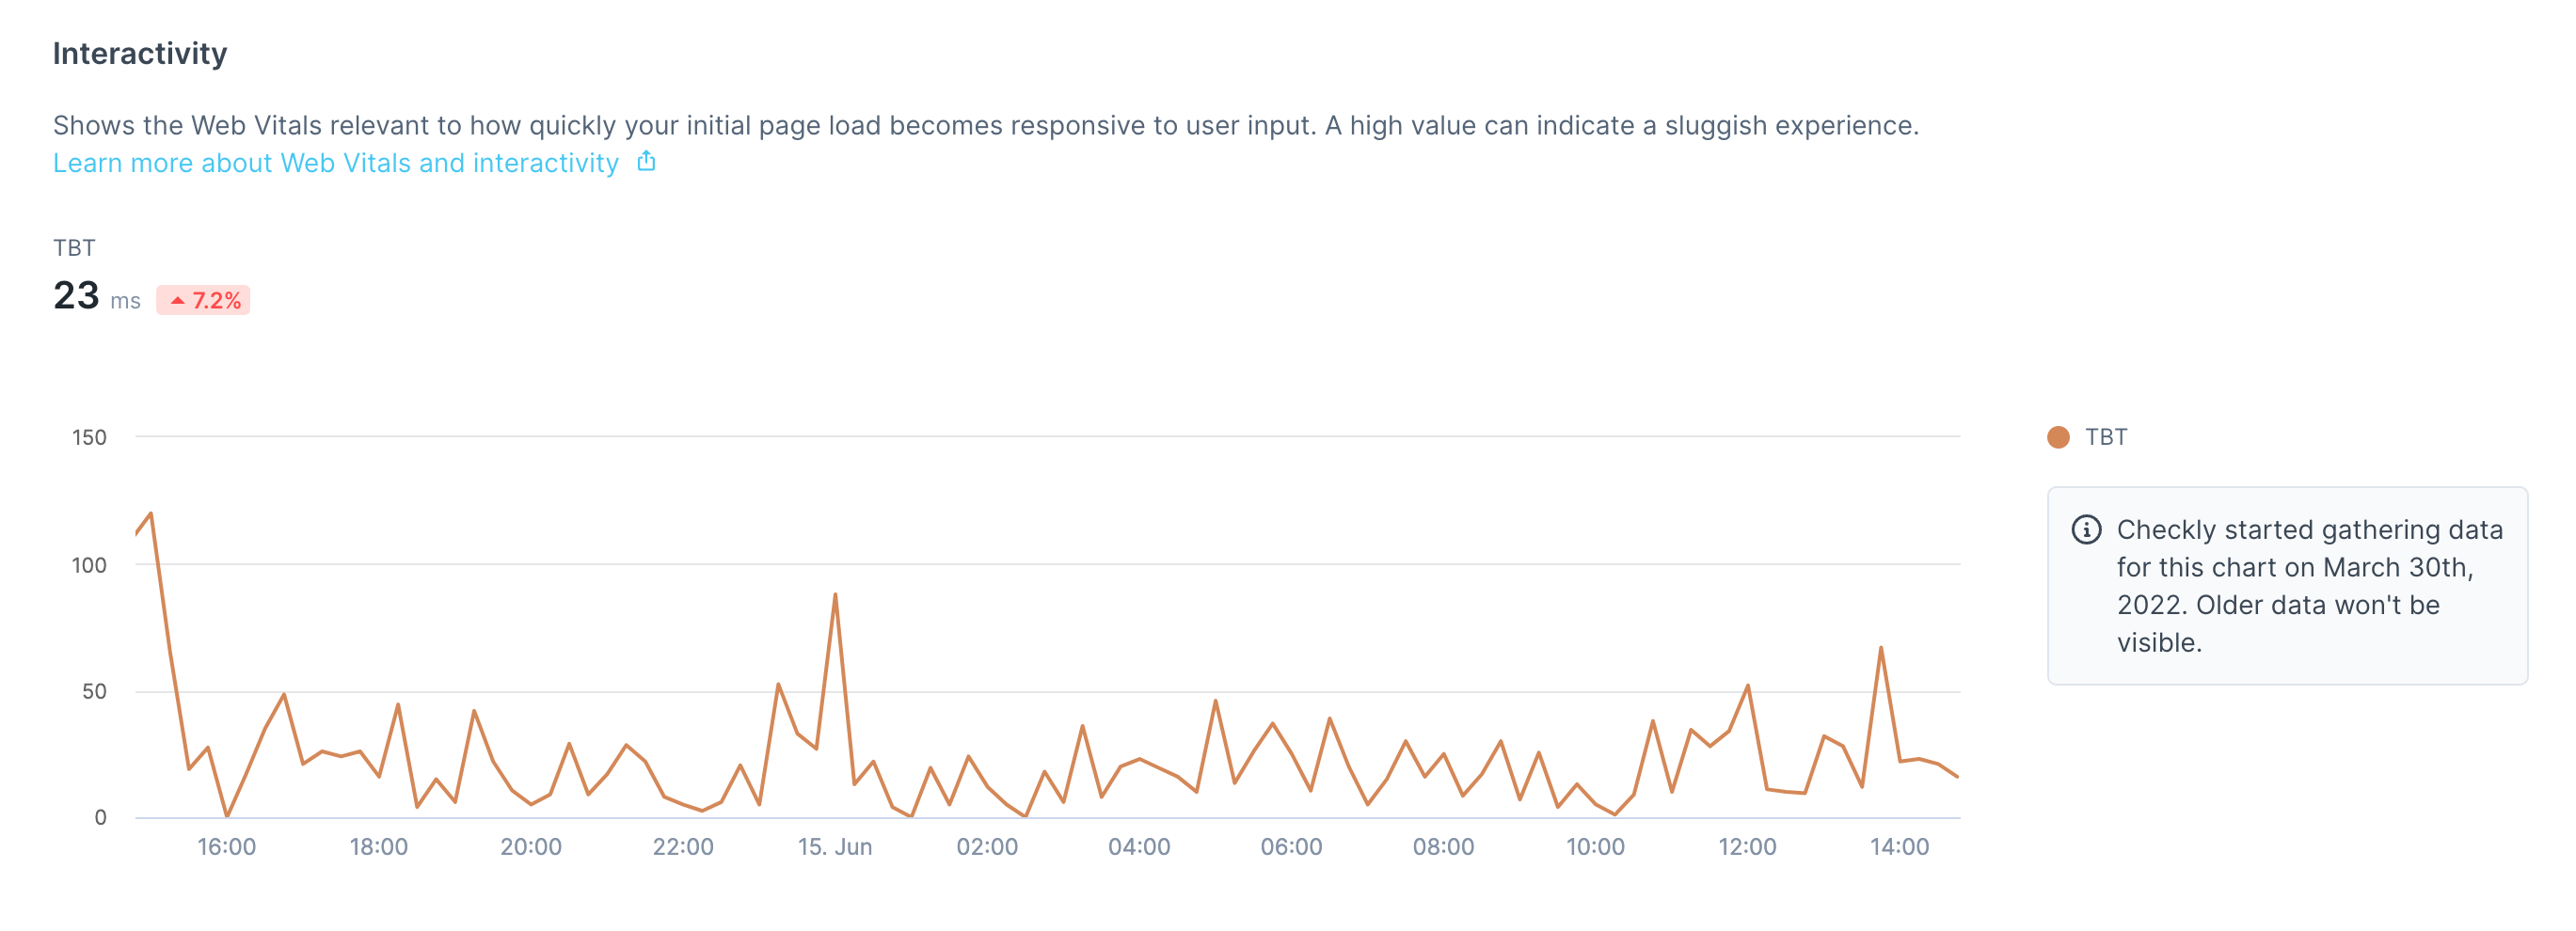
An interactivity summary
-
A visual stability breakdown
Navigating individual check results
The check result page will contain results from multiple locations when using parallel scheduling. Navigate between each location using the sidebar.
- API checks
- Browser checks
- Multistep checks
- Heartbeat monitors
- TCP monitors
- DNS monitors
- ICMP monitors
- URL monitors
Check results with retries
When checks are retried, a dropdown will indicate that the check result contains multiple check runs:- The initial failed attempt
- The final result (which may have failed or succeeded)