What are ICMP Monitors?
ICMP monitors check if a host is reachable by sending ICMP Echo Requests (pings). Typical use cases include:- Verifying reachability for servers, load balancers, or network appliances that don’t expose HTTP endpoints or open TCP ports
- Detecting network-level outages before they’re visible via HTTP endpoints
- Monitoring latency across regions to identify geographic performance issues
- Tracking packet loss to catch network quality degradation early
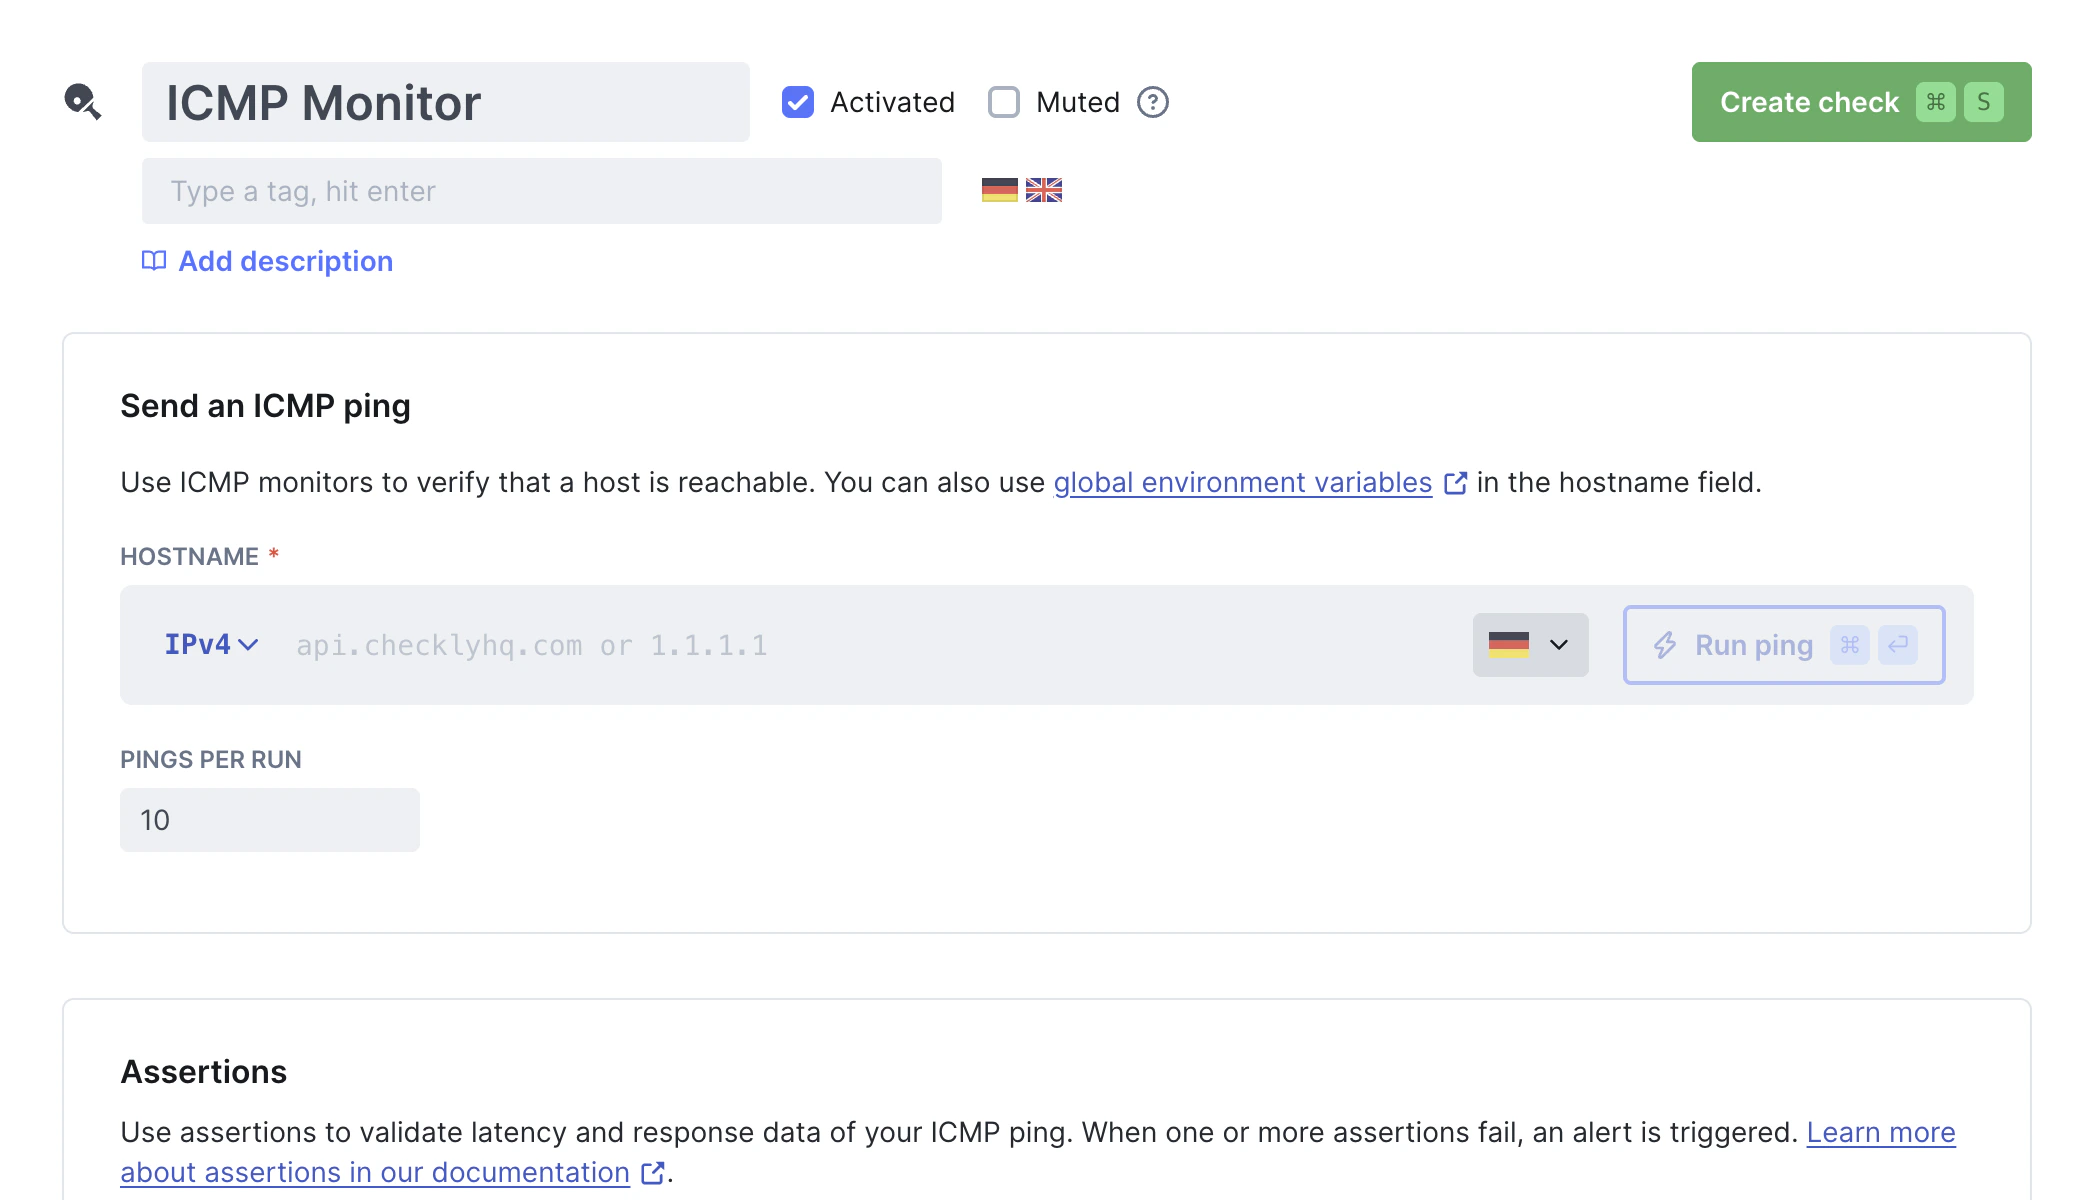
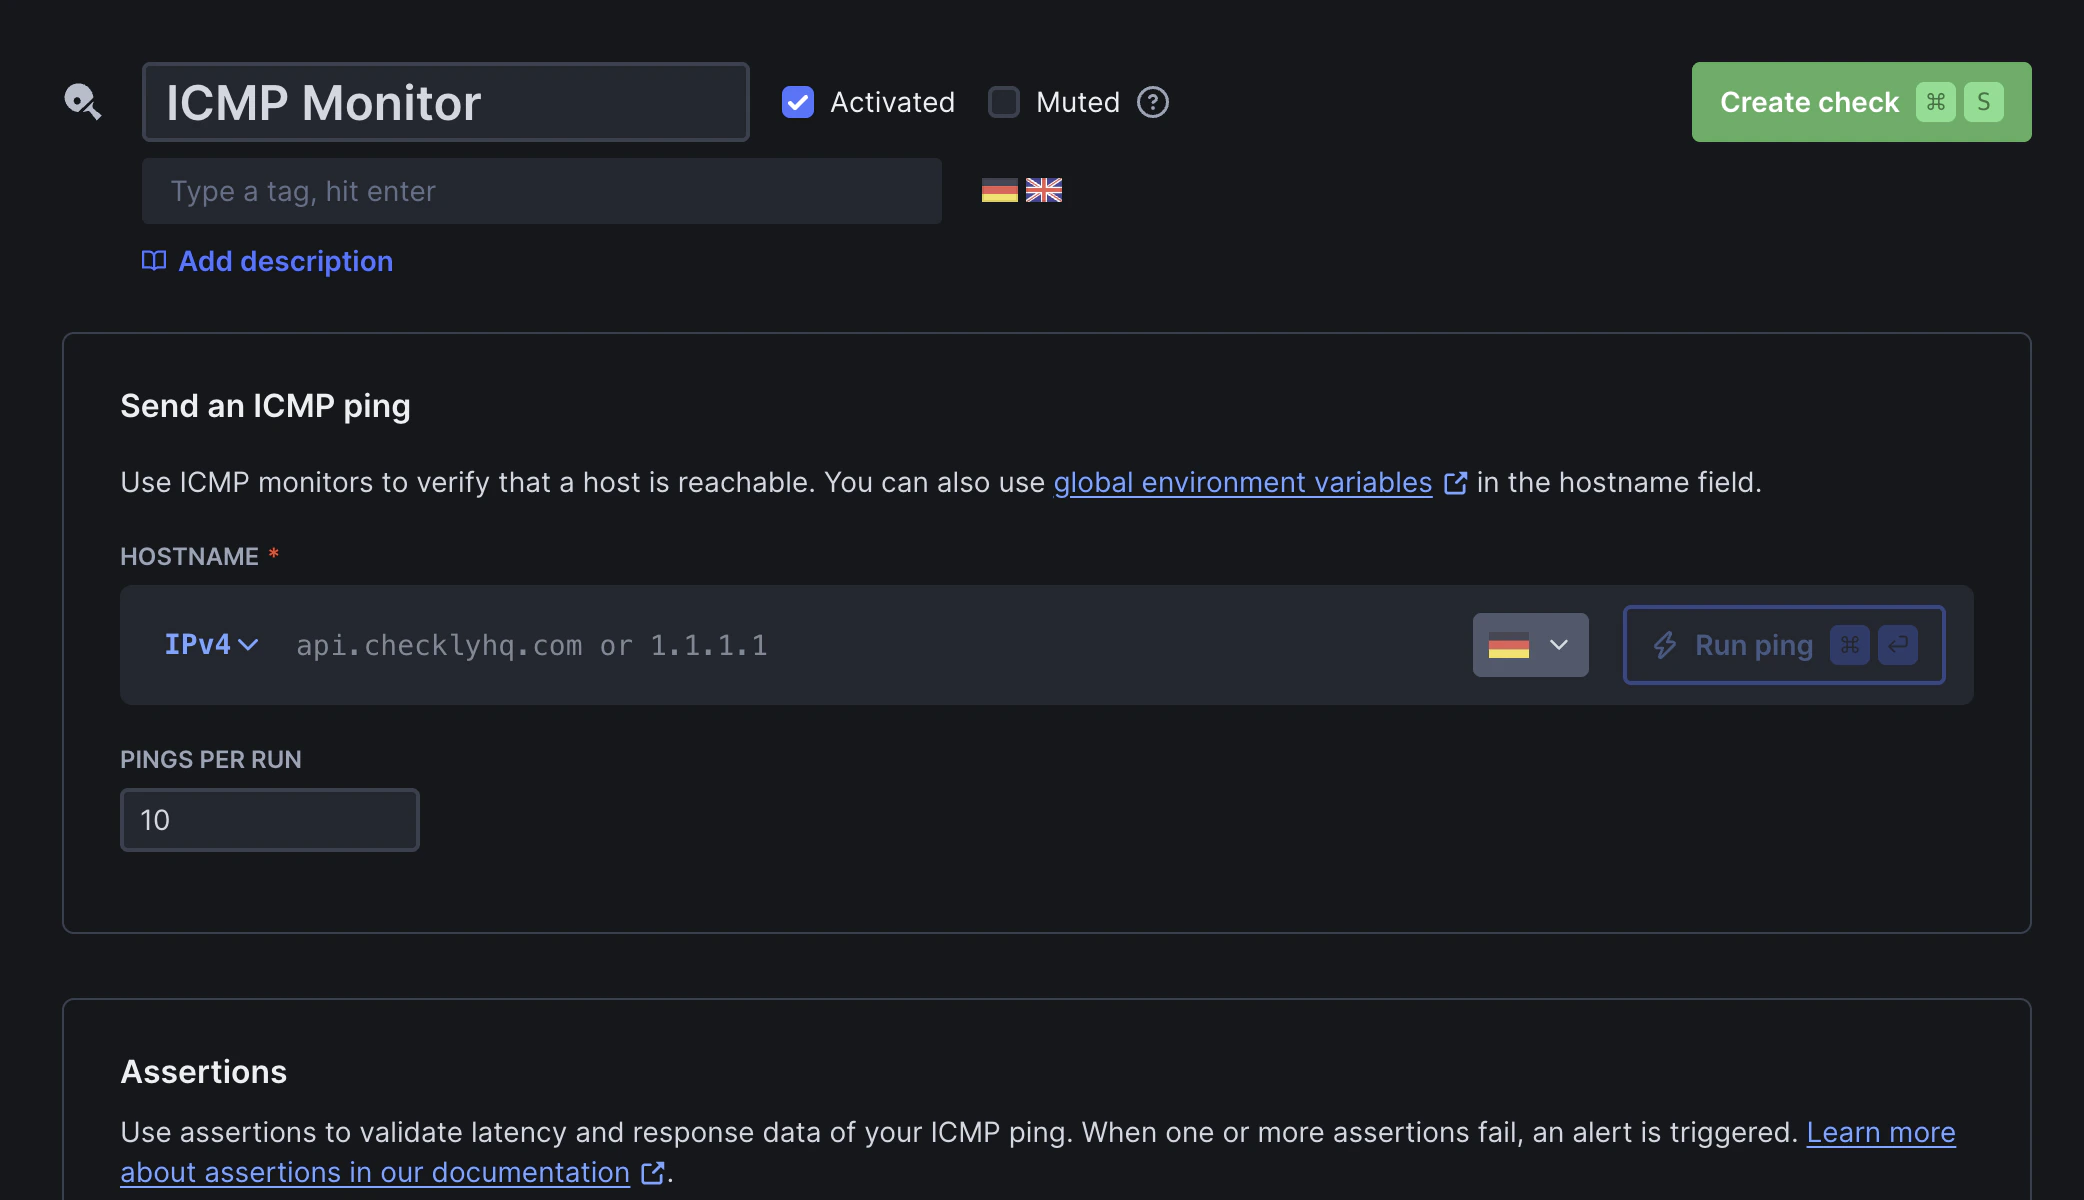
How do ICMP monitors work?
ICMP monitors perform ping tests:- Hostname resolution: If a hostname is provided, Checkly resolves it to an IP address
- Ping execution: Multiple ICMP Echo Request packets (configurable from 1–50, default: 10) are sent from your configured locations, with a 500 ms interval between each ping
- Response validation: ICMP Echo Reply packets are received. Round-trip latency and packet loss are measured and evaluated against your configured assertions
checklyhq.com with 3 pings returns:
ICMP Monitor Results
Select a specific check run to inspect its results: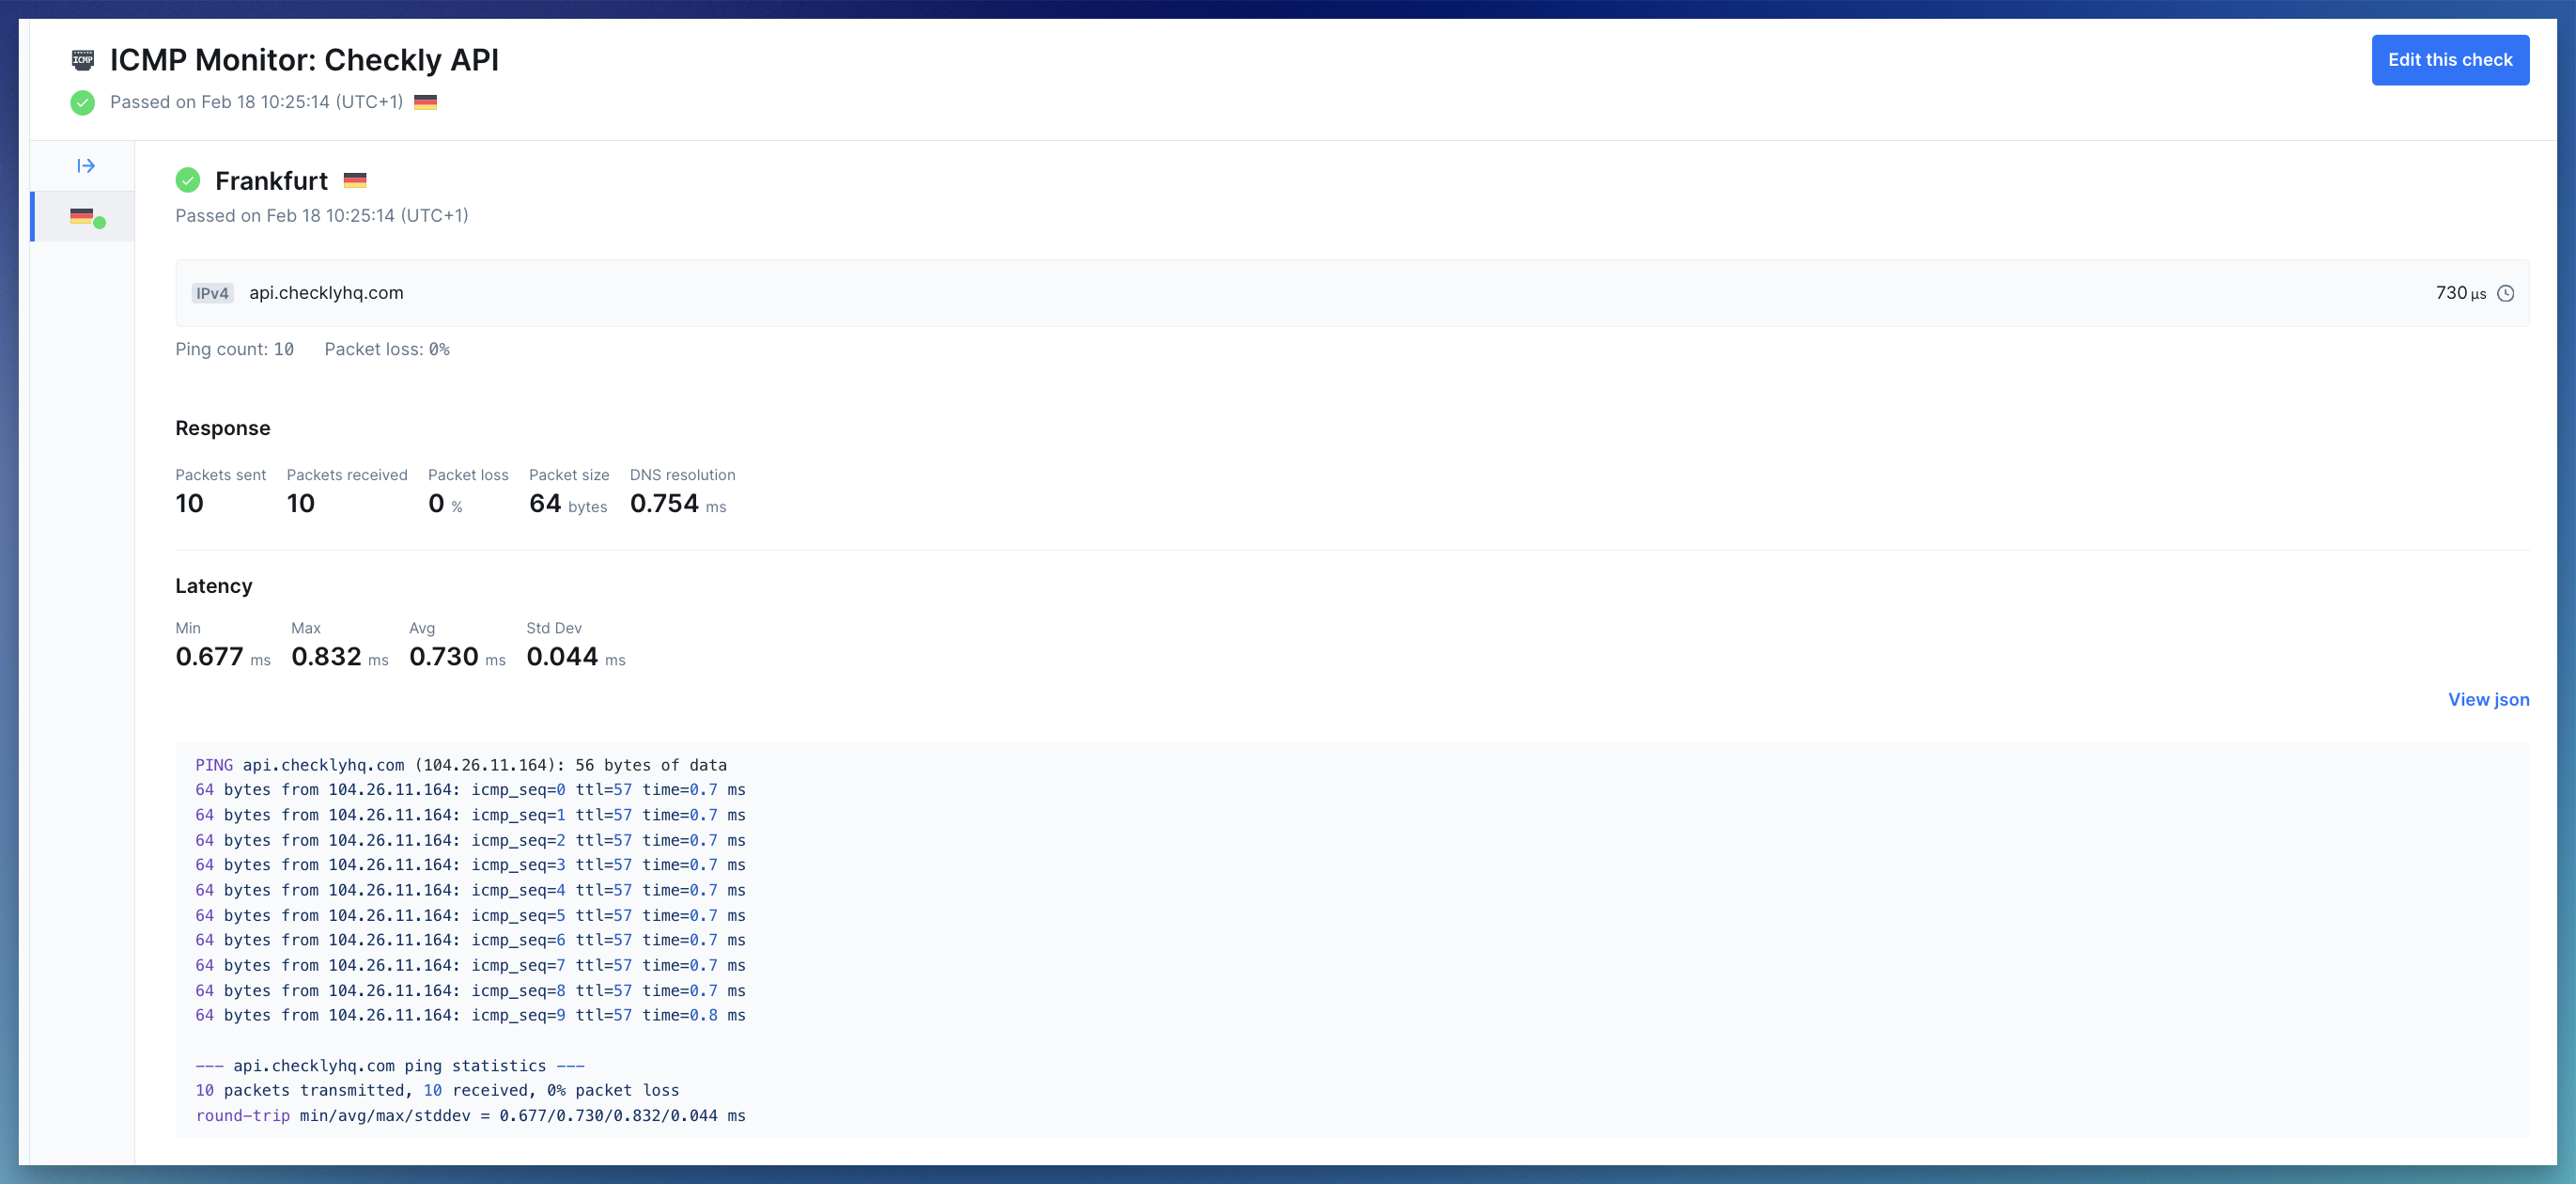
- Summary: Shows the target (hostname or IP), the monitor state (passed, degraded or failed), and average latency
- Error details: If a run fails, you’ll see the error status code and message to help diagnose what went wrong
-
Response metrics: Network metrics collected during the run:
- Packet info: packets sent, packets received, packet loss, and packet size
- DNS resolution time: how long it took to resolve the hostname to an IP address
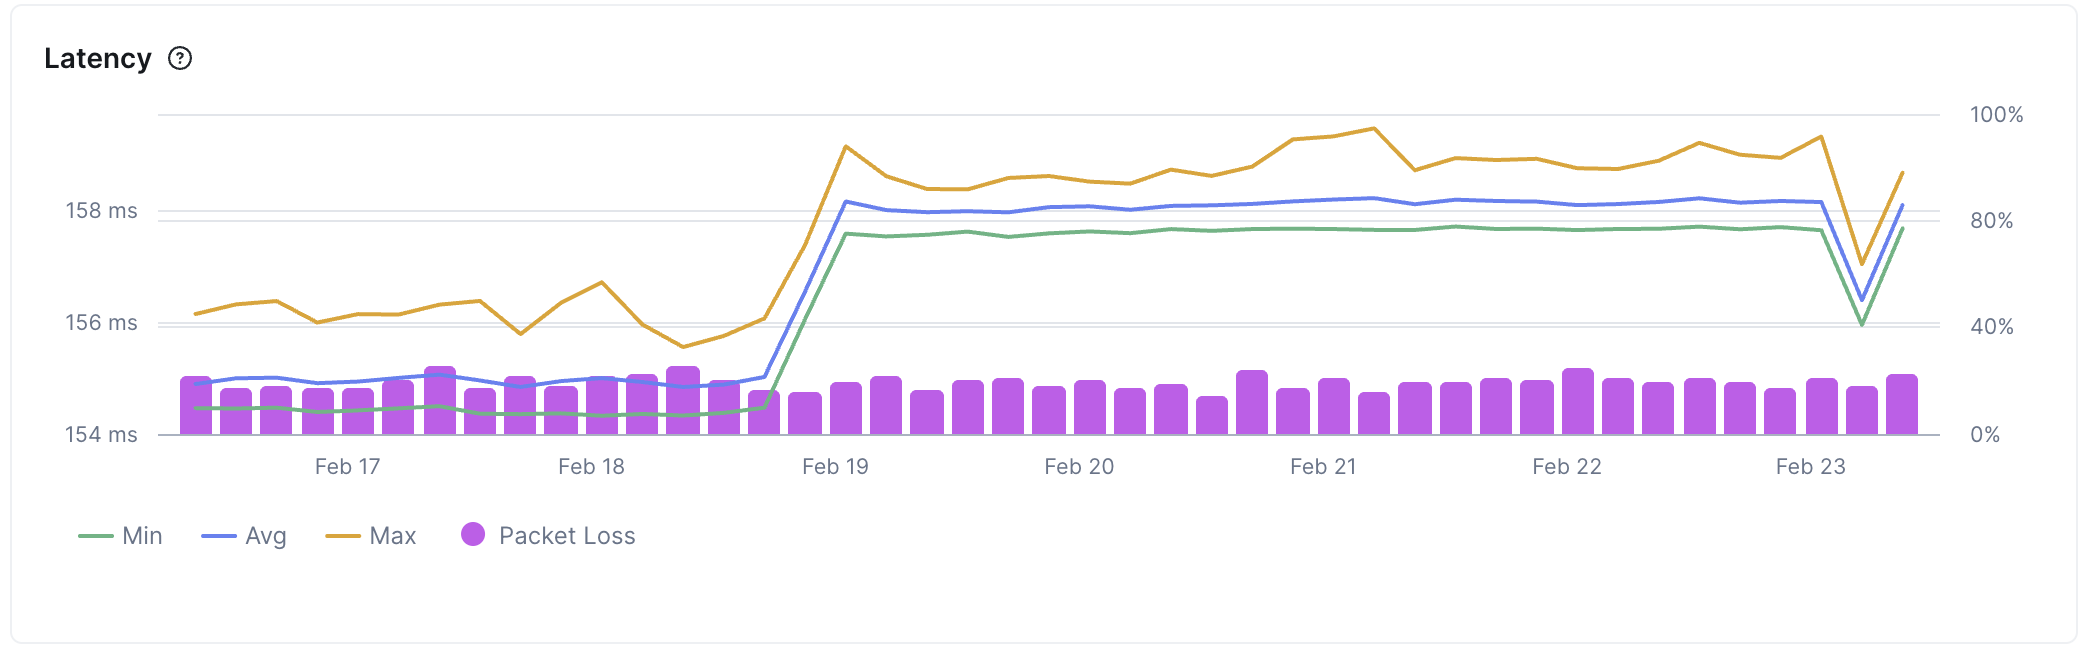
- Latency: min, max, avg, and std dev of round-trip times (RTT) across all received packets
- Response payload: Shows the raw ping result. Also available as parsed JSON
Troubleshooting Common Issues
Raw socket permission denied for ICMP monitors on private locations
Raw socket permission denied for ICMP monitors on private locations
Container runtimes drop In Docker:Docker does not set
NET_RAW by default. ICMP monitors need raw sockets, so the Checkly Agent needs this capability explicitly granted.How to fix:In Kubernetes, update your pod spec or Helm values:allowPrivilegeEscalation=true— prevents Kubernetes from setting theno_new_privsbit on the container process, which would otherwise block file capabilities (likecap_net_raw+epon the ping binary) from taking effect.capabilities.add=["NET_RAW"]— addsCAP_NET_RAWto the container’s bounding and permitted capability sets, allowing the kernel to open the raw sockets (SOCK_RAW).
no_new_privs by default, so --cap-add is sufficient. If you run with --security-opt no-new-privileges, file capabilities on binaries will be blocked — remove that flag to allow NET_RAW.NET_RAW only grants permission to create raw sockets. It does not escalate broader container privileges.100% packet loss but the host is reachable via HTTP
100% packet loss but the host is reachable via HTTP
Symptom: ICMP monitor shows complete packet loss, but the website/API works fineRoot cause:
- Many organizations block ICMP echo request packets at the firewall, load balancer, or host level as a security measure
- Verify HTTP connectivity: Create an API or URL monitor for the same hostname to confirm it’s reachable
- Check both protocols: Test both IPv4 and IPv6, some hosts allow ICMP on one protocol but not the other
- Confirm with infrastructure team: Ask if ICMP is intentionally blocked in security policies