

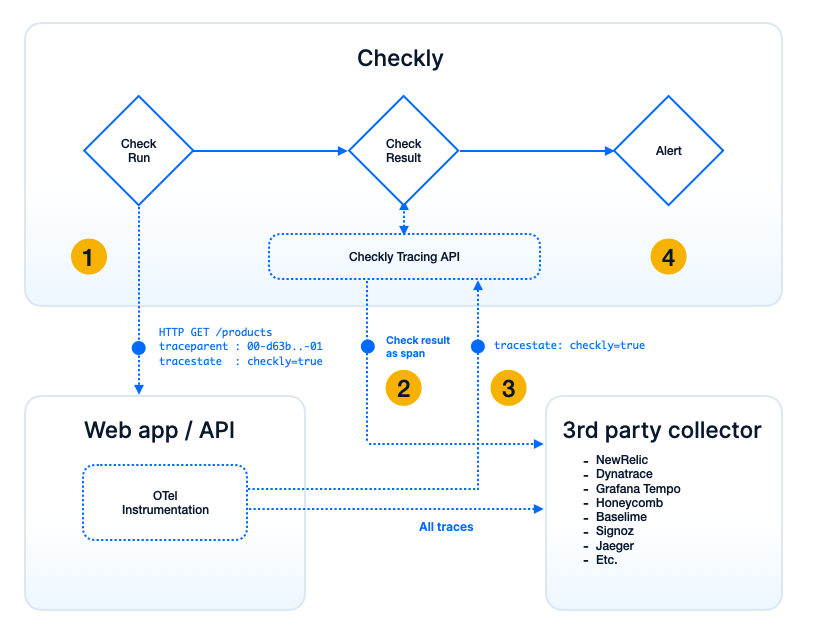
The Flow
1
Automatic Instrumentation
When enabling the integration, Checkly automatically instruments all HTTP requests made by your checks with
traceparent and tracestate headers. These HTTP requests hit your web application and/or API when running checks.All synthetic check types, including API, Browser and Multistep checks, include these headers:- traceparent: W3C compliant trace ID generated for each HTTP request that is part of a check. For Browser checks and Multistep checks, there can be multiple requests instrumented.
- tracestate: Set to
checkly=trueto identify Checkly as the vendor that generated the trace
2
Check Result Export
You can configure your 3rd party backend in the Checkly UI so we can export every check result as a span to your backend. This correlates all backend spans with the check run that triggered them, together with full context of the check run.Check details are stored in the This provides rich context about the run location, check name, check type, and more.
checkly namespace as attributes on the span:checkly.check.tags carries the check’s tags as a string array — the check’s own tags first, then tags inherited from its group, deduplicated. Use it to filter or group traces by the same labels you organize your checks by, such as a team or workflow tag.Tag caveats:
- The attribute is only present when the check has tags. At most 20 tags are exported per span, and a tag longer than 128 characters is omitted entirely rather than truncated.
- Attributes are set on Checkly’s root span only — they do not propagate to your application’s own spans within the trace. To find a whole trace by tag, filter on the root span, then use its trace ID.
3
Direct Trace Ingestion
No 3rd party backend needed. This is what kicks Checkly’s OpenTelemetry integration into high gear, and it works even if you don’t have a 3rd party OTel backend already set up.By adding the correct OTel libraries and simple filter statements, you can send ONLY the traces related to your Checkly checks back to Checkly:
- Endpoint:
otel.eu-west-1.checklyhq.com/v1/traces - Filter: Only traces marked
tracestate: checkly=true - Result: Traces appear in Checkly UI alongside check results
4
Alert Integration
When your check breaks, you get an alert that points to a check result containing a full trace of the check run, including all backend spans:
- Complete trace of the check run
- All backend spans included
- Quick root cause identification
- No need to jump between tools or dashboards
Steps 3 and 4 provide the most value - complete trace visibility without requiring a 3rd party OpenTelemetry backend.