

Prerequisites
Prerequisites
A plan that includes the Prometheus integration, otherwise the endpoint returns
403.Set up
- Go to Account settings > Integrations and find the Prometheus card. It shows your endpoint URL, your bearer tokens and a scrape config sample. If the card shows a Create Prometheus endpoint button instead, click it first; the URL and tokens appear once the endpoint exists.

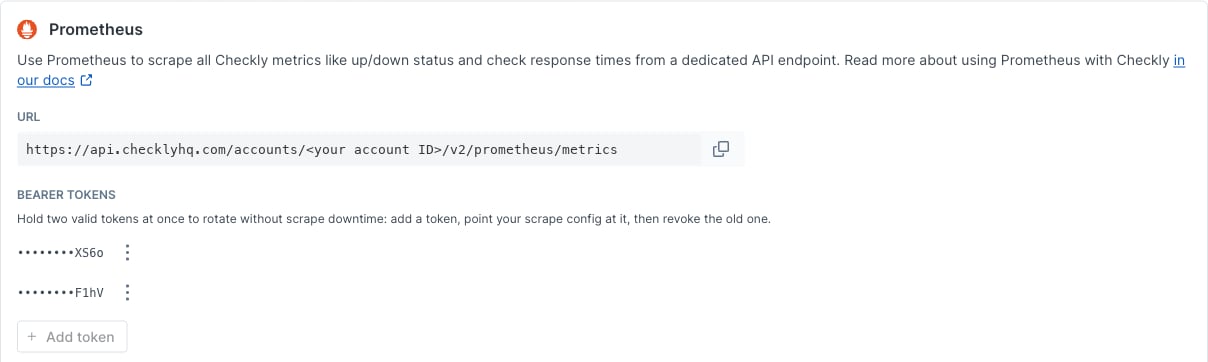
- Under Bearer tokens, click Add token and copy the value. The full value is shown only once, right after you create it. An account can have at most two tokens, so you can rotate: add a token, point your scrape config at it, then revoke the old one.
- Add the
checklyjob underscrape_configsin yourprometheus.ymland replace the placeholders with your account ID and token. It matches the sample on the card, plusscrape_timeout: 30s.
- Restart Prometheus. Metrics appear after the first scrape.
Options
Add these query parameters to the endpoint URL, or underparams in the scrape config. The sample above turns on includeRetryAttempts and locationLabelEnabled, like the sample on the card.
The endpoint rejects any other query parameter, and values other than
true or false, with 400. Each combination of parameters is cached separately.
Check metrics
Together these metrics cover every check type. Each one also carries the labels listed under Labels. The Labels column below lists the extra ones.
For example, a passing check reads:
checkly_check_status can be useful for viewing the current status of a check, whereas checkly_check_result_total can be useful for calculating overall statistics.
checkly_check_result_total counts check results for statistics and alerting. It is not a billing measure and does not match the usage shown on the Billing page or by checkly account usage summary.Labels
Heartbeat metrics
Heartbeat monitors are passive checks that wait for your scheduled jobs and automated processes to send a ping. The Prometheus exporter includes Heartbeat monitors in the standardcheckly_check_status and checkly_check_result_total metrics, plus two heartbeat-specific gauges designed for dead man’s switch alerting.
How heartbeats map to checkly_check_result_total
Heartbeat monitors count in checkly_check_result_total over the same hourly window as other check types. The status label values map to heartbeat event states as follows:
Dead man’s switch PromQL examples
Alert when a heartbeat ping is overdue
Compare the current time against the last success timestamp. If the difference exceeds the expected interval, the job has missed its window:Alert with a safety margin
Multiply the interval by a margin such as 1.5 to avoid false alarms from minor delays:Grafana table of heartbeat health
Show how long ago each heartbeat was last seen:Private location metrics
The Prometheus exporter also contains metrics for monitoring private locations. Use them to make sure your private locations have enough Checkly Agent instances running to execute all of your checks, and to drive agent autoscaling. Every private location metric carries the labelsprivate_location_name, private_location_slug_name and private_location_id. Check runs flow through two queues: main carries Browser checks, Multistep checks and Playwright Check Suites, and uptime carries API checks, URL monitors and the TCP, DNS, ICMP, SSL, gRPC and Traceroute monitors.
For metrics scraped from the agent container itself, including an opt-in per-check set with the
checkly_agent_ prefix, see Agent metrics.
Behavior
-
Caching and limits. Responses are cached for 60 seconds, so a scrape interval below 60 seconds fetches the same data. Responses are gzip compressed when the scraper asks for it, which Prometheus does by default. The endpoint allows 50 requests per minute per account. Above that it returns
429withRetry-After,X-RateLimit-Limit,X-RateLimit-RemainingandX-RateLimit-Resetheaders. If you run multiple Prometheus instances, each instance scrapes independently. Align their scrape intervals where possible. -
Errors. An unknown token or a lapsed account returns
401. A revoked token can keep working for up to 10 minutes. Tokens do not expire. A plan without the Prometheus integration returns403. -
Timeouts. A scrape fails as a whole if any part of the backing query fails. The query times out after 25 seconds, and a scrape that arrives while another one is refreshing the cache waits for that refresh. For accounts with many checks, keep
scrape_timeoutat30sor higher. -
Hourly window. Counters and histograms reset every hour at HH:01:30, for example 14:01:30. Handle the resets with the rate or increase functions. Gauges built from runs reset too. After the reset and until a check’s next run:
checkly_ssl_monitor_days_until_expiry,checkly_icmp_monitor_packet_loss_ratioandcheckly_traceroute_monitor_hopsread0.checkly_check_http_status_code,checkly_grpc_monitor_status_code,checkly_traceroute_monitor_destination_reached,checkly_ssl_monitor_info,checkly_ssl_monitor_hostname_verified,checkly_ssl_monitor_chain_trusted,checkly_ssl_monitor_ocsp_stapledandcheckly_ssl_monitor_key_size_bitsdisappear.- With
locationLabelEnabled, each location reads0or is absent until it runs, so checks that run round-robin read0on most locations. - A monitor that runs every hour reads
0from the reset until its run. One that runs less often reads0in every hour without a run.
checkly_ssl_monitor_days_until_expirygauge below a threshold therefore fires after every reset until the monitor runs again. Alert on its highest value over a range longer than the monitor’s interval instead, for example withmax_over_time.checkly_time_to_ssl_expiry_secondsandcheckly_check_statusread the current status and do not reset. -
Histograms. Histograms expose only the
+Infbucket. Use_sum / _countaverages as in Histogram averages, nothistogram_quantile(). A missing web vital counts as0and pulls averages down. -
Tag parsing. Checkly does not clean up tag keys. The label name is the run of letters, digits and underscores right before the first colon, and the value is everything after that colon:
my-env:prodbecomesenv="prod", anda:b:cbecomesa="b:c". A key that starts with a digit produces an invalid label name, and a tag whose key matches a built-in label name is ignored. See the Prometheus data model for valid label names. -
Retries. Retry attempts are left out unless you set
includeRetryAttempts=true.checkly_check_status,checkly_time_to_ssl_expiry_secondsand all heartbeat metrics ignore the parameter.
PromQL examples
Currently failing checks
To graph whether checks are passing or failing, use the query:1 while failing and degraded checks will have the value 0.
This can be used to build a Grafana table of currently failing checks.
Failure percentage
To calculate the share of check runs that failed in the last 24 hours, as a ratio from 0 to 1, use:locationLabelEnabled, a location with no runs in the window returns NaN for this query.
Histogram averages
The different histogram metrics can all be used to compute averages. For example, query the average web vitals times for a check using:Scraping with other tools
Theprometheus receiver of the OpenTelemetry Collector, included in the otelcol-contrib distribution, scrapes the endpoint with the same settings. Replace debug with the exporter for your backend.
prometheus.scrape, use the same URL, bearer token and interval.
Legacy v1 endpoint
The v1 endpoint is/accounts/<your account ID>/prometheus/metrics. It takes the same bearer tokens, allows 300 requests per minute, caches responses for 30 seconds and accepts only the disableTagParsing parameter.
Legacy v1 metrics and labels
Checks with no run in the last hour are absent from the three check metrics. Labels:
checkly_check_statusandcheckly_check_degraded_status:check_name,check_type,muted,activated,degraded,groupfor checks in a check group,tagsand tag labels.checkly_check_result:check_name,check_type,region,groupfor checks in a check group,http_status_codeon API checks only,tagsand tag labels.check_typeis any check type in lowercase.mutedandactivatedare the check’s own settings, without its check group.tagsholds only the tags that are notkey:value. Eachkey:valuetag becomes a label: the key is the text before the first colon, with any characters, soteam-x:yproduces the invalid label nameteam-x. The value stops at the second colon. Label values are not escaped.- The private location metrics carry
private_location_name,private_location_slug_nameandprivate_location_id.
Legacy v1 example output
checkly_check_statusandcheckly_check_degraded_statuscarrymuted,activatedanddegraded, reflecting whether a check sends alerts, is running and is degraded. “Customer API” is in a check group, so it also carriesgroup.checkly_check_resulthas one row per region that ran the check in the last hour, with aregionlabel. A run from a private location carries the private location’s slug as its region. Rows for API checks also carryhttp_status_code.- The private location “ACME data center” has one Checkly Agent connected.
checkly_private_location_queue_sizeandcheckly_private_location_oldest_scheduled_check_runshow no backlog of check run jobs.
Legacy v1 scrape config
text/html. Prometheus 3 and later reject that unless the job sets fallback_scrape_protocol, as above. Prometheus 2 does not know that setting, so remove the line there.
For a worked example with Grafana, see the blog post on monitoring website performance with Checkly, Prometheus and Grafana.